Foreign Direct Investment (FDI)
The Organisation for Economic Co-operation and Development produces an annual report regarding the amount of foreign direct investment.
The source for all figures relating to FDI on this page is: http://www.oecd.org/investment/FDI-in-Figures-Feb-2014.pdf
The source for all figures relating to FDI on this page is: http://www.oecd.org/investment/FDI-in-Figures-Feb-2014.pdf
FDI: Global flows - how much?
|
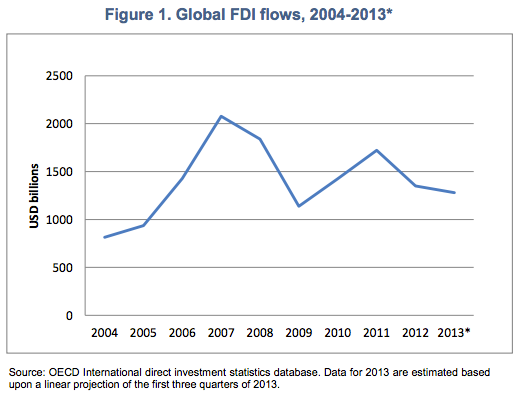
The graph to the right shows that FDI peaked in 2007 before the 2008 global financial crisis. Since then, though there have been various changes, the trend remains that FDI is falling. This is because
|
|
FDI: Inflows and outflows
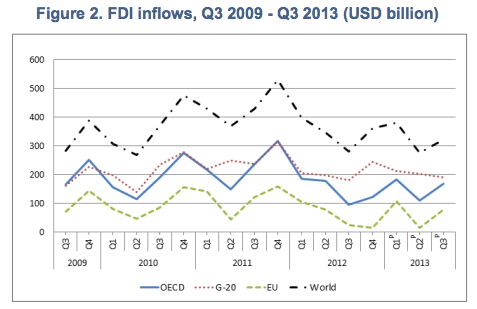
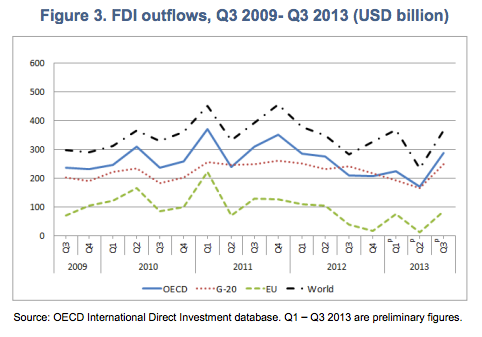
The graphs below show inflow and outflows. This refers to the FDI leaving the country of origin, compared to arriving in the destination country. The lines represent:
OECD: 34 countries aiming to foster better economic development in partnership with social progress; it includes mainly advanced economies such as the UK and USA, but also developing economies such as Turkey and Chile. It does not include India, China or Brazil.
G20: A collection of 19 of the 34 largest economies in the world, plus the European Union (which makes the '20th' country).
EU: The member states of the European Union, which in March 2015 comprised 28 member states.
Note: Q3 refers to Quarter 3, i.e. the third quarter of the year.
|
|
The amount of FDI inflow worldwide is clearly very high, reaching over US$500bn in Q4 of 2011. This figure applies only to that quarter of the year, so FDI for the entire year was somewhere around US$1700bn (US$1.7 trillion). It's also possible to see that it fluctuates significantly. Even so, this dwarfs the amount of money flowing through remittances.
Note: The reason for the variation between the graphs is that these lines represent FDI even within the regions, so it's possible that a company may invest in another country within the same region.
Note: The reason for the variation between the graphs is that these lines represent FDI even within the regions, so it's possible that a company may invest in another country within the same region.
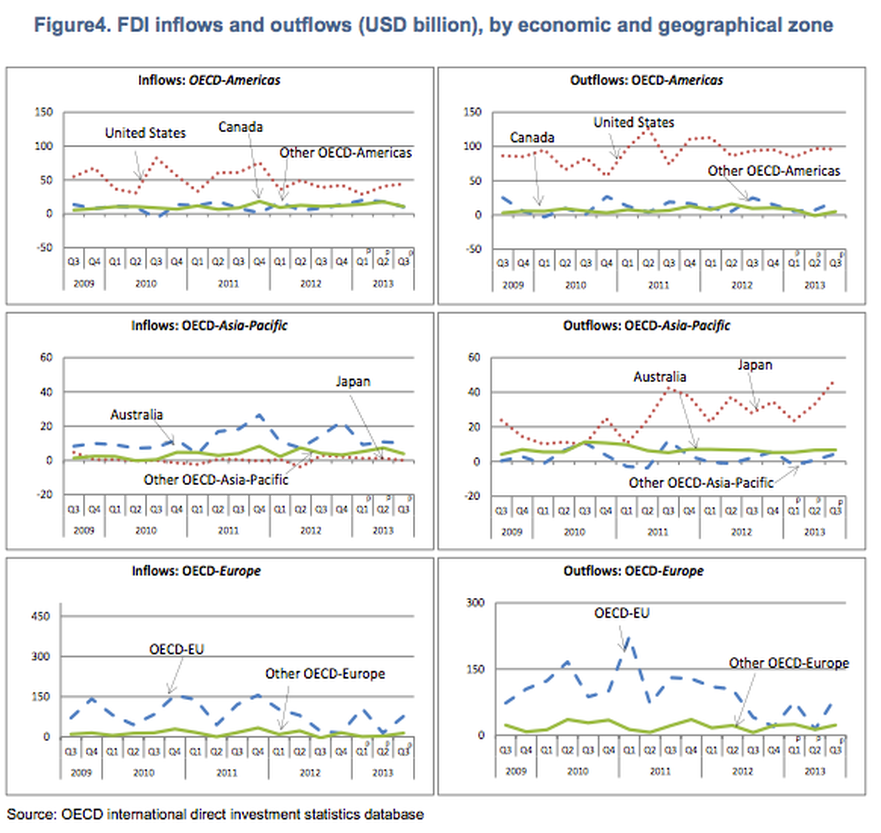
The importance of FDI flows in different regions
The graphs below clearly identify FDI as being much larger in Europe, followed by North America, then Asia. This reflects the large economies of the regions, plus the number of countries within Europe. These countries are geographically close to each other, and have a small land area, making FDI across the many international borders within Europe easier.
Repatriation of Profits
The repatriation of profits refers to the return of money earned in another country to the country where the business is owned. Factors that affect the amount of money repatriated include:
Host countries want as much of the profit to remain in their country, as this helps their economy. However, TNCs are often seen as being too powerful and able to dictate terms to the host countries.
- If the host country has offered tax incentives to the TNC, resulting in a greater amount of profit from reduction in tax
- The amount of future investment the TNC wishes to make in the host country; if it wants to make a future investment, it is likely to use the profits for this to avoid transaction and currency exchange costs
- Taxes in the country where the head office is located: if the country of origin has high taxes, it is more likely that profits will be sent for investment in other countries
Host countries want as much of the profit to remain in their country, as this helps their economy. However, TNCs are often seen as being too powerful and able to dictate terms to the host countries.
|
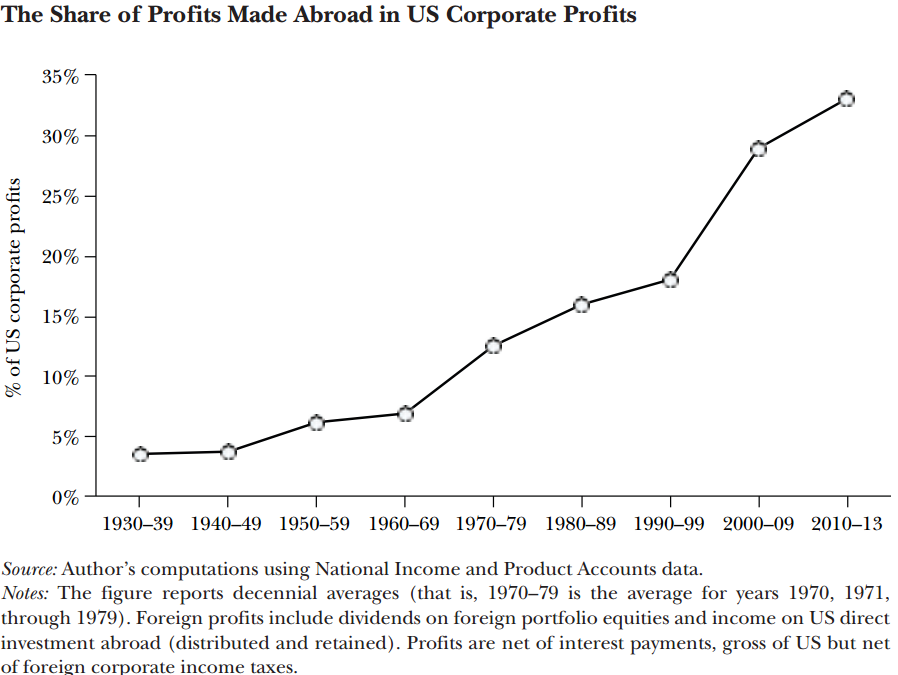
The graph to the right shows the share of profits for US companies made abroad, and therefore is an approximation for the amount of profit repatriated to the US (though it's not an exact relationship!). It's clear that the importance of this financial flow has significantly increased in the last eighty years.
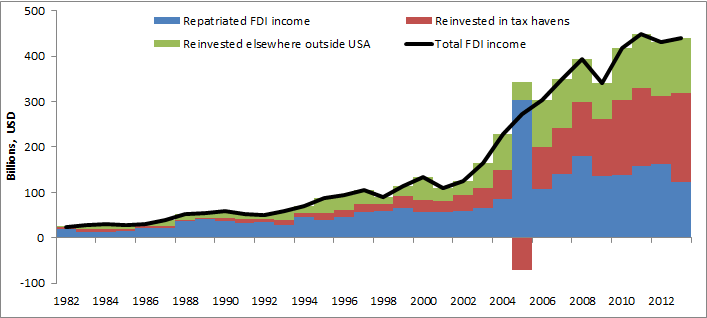
The graph below shows the destination of FDI, with the blue part of the graph showing repatriated profits for the USA. It's clear to see that not the total mount of profit is repatriated to the USA at all, but this still makes a signficant financial flow, reaching a peak of approximately US$300bn in 2004. As with FDI, it's clear that these amounts of money involved in the financial flow are much larger, and therefore important, than for remittances. |
Source: http://ftalphaville.ft.com/2014/11/19/2040542/the-costs-of-offshore-tax-avoidance-part-1/
|
Source: http://ftalphaville.ft.com/2014/11/19/2040542/the-costs-of-offshore-tax-avoidance-part-1/
