Instructions for my students
The guide for my students is in a Google Doc. You can access it here if you are one of my students.
Getting started: Fieldwork question and hypotheses
Fieldwork questions
Before you begin your work you need to identify a good fieldwork question. This will mean choosing what to write up:
Regardless of which you decide to pursue, you need a clear fieldwork question. The IB states "it must be narrowly focused, appropriate and stated as a question that can be answered through the collection of primary information in the field". Ideally your question will involve something that is debatable such as:
The name of the location you study should be part of the fieldwork question. An example is:
The following examples are taken from www.geography-fieldwork.org
Hypotheses
A hypothesis is a statement. It does not need to start with 'I predict that...' although you can include these words if it helps you to think it through.
Hypotheses must be:
A bad example is:
"Temperature and urban heat islands are linked to wind."
This should be improved to:
"Increases in temperature are positively correlated to decreases in wind speed."
The following examples are taken from www.geography-fieldwork.org and are specific to river studies, but the format is appropriate for any hypothesis. Note that they each have the name of the location, two specific factors that are being tested, and the direction of correlation (positive or negative / increasing together, decreasing together, or in opposite directions).
Before you begin your work you need to identify a good fieldwork question. This will mean choosing what to write up:
- microclimates
- urban heat islands
- general microclimates
- major influences on urban microclimates such as distance from open water, canyons and green spaces
- urban stress
- retail environments
- agglomeration
- core-frame model (CFM)
- order of shops
Regardless of which you decide to pursue, you need a clear fieldwork question. The IB states "it must be narrowly focused, appropriate and stated as a question that can be answered through the collection of primary information in the field". Ideally your question will involve something that is debatable such as:
- To what extent...
- How and why...
- How much is...
- What factors affect...
The name of the location you study should be part of the fieldwork question. An example is:
- "How far can the core-frame model be applied to Hong Kong's central business district?"
The following examples are taken from www.geography-fieldwork.org
- How does the River Onny change downstream?
- How successful are the coastal defences at Beesands?
- What is the urban fringe like around Penrith?
- Is Henley-in-Arden a typical suburbanised village?
Hypotheses
A hypothesis is a statement. It does not need to start with 'I predict that...' although you can include these words if it helps you to think it through.
Hypotheses must be:
- A statement (no question mark!)
- A single sentence (no explanation until later)
- Testable, using specific factual evidence
- Refer to two variables - no more, no fewer
- Indicate the direction of correlation
- Be based upon expected results
A bad example is:
"Temperature and urban heat islands are linked to wind."
This should be improved to:
"Increases in temperature are positively correlated to decreases in wind speed."
The following examples are taken from www.geography-fieldwork.org and are specific to river studies, but the format is appropriate for any hypothesis. Note that they each have the name of the location, two specific factors that are being tested, and the direction of correlation (positive or negative / increasing together, decreasing together, or in opposite directions).
- Hydraulic radius increases with distance from source in the River Onny
- Load particle size decreases with distance from source in the River Onny
- Cailleux Index of roundness increases with distance from source in the River Onny
Sampling
The main reason that students miss out on good marks in Section B (Method of Investigation) and Section E (Evaluation) is a lack of understanding of sampling.
Imagine that you have a queue of 1000 people who are entering a concert. You want to know how they arrived at the venue that evening. You clearly don't have time to ask each person how they arrived, so you need to select some people from the queue and ask them. This is sampling.
However, to avoid your personal bias affecting your results, you need to select people carefully. Otherwise you might only ask the first 10 people - in which case, your results will show how people who arrived early got to the venue. This might make it more likely that you will have public transport listed, as people need to add more time in case of cancelled trains etc. Or, you might ask the last 10 people - in which case, being dropped off by a friend in a car might be more common, because they didn't need to worry about time spent trying to park and they could risk being late. Or, perhaps you choose people from all along the line, in which case you might avoid 'scary' looking people, or people who are talking and you don't want to interrupt. Sampling methods are how you avoid such bias.
For the purposes of your project, you need to identify whether you used random, systematic or stratified sampling. You also need to identify if it was point, line or area sampling. Some great sources on this are:
- David Waugh's textbook 'Geography: An Integrated Approach' (Search the index for 'sampling' and go the three page spread. You can largely ignore the first page about standard distribution.)
- https://www.geography-fieldwork.org/geographical-enquiry/before-you-start/2-fieldwork.aspx
- https://www.rgs.org/OurWork/Schools/Fieldwork+and+local+learning/Fieldwork+techniques/Sampling+techniques.htm
- http://geography-student.blogspot.hk/2012/01/sampling-methods.html
- http://www.geoib.com/sampling.html
- http://geographyfieldwork.com/urban_sampling.htm
Useful websites for statistics and write up
Statistical treatment of the data
'Treatment' of data means that you do something to it. Don't just present your data - interrogate it to find out what it tells you.
Presentation of data
General presentation methods - http://www.geography-fieldwork.org/geographical_enquiry/stage4.htm
Do you need a bar graph or a histogram? http://stattrek.com/statistics/charts/histogram.aspx
'Treatment' of data means that you do something to it. Don't just present your data - interrogate it to find out what it tells you.
- Descriptive statistics versus inferential statistics: http://study.com/academy/lesson/descriptive-and-inferential-statistics.html and https://statistics.laerd.com/statistical-guides/descriptive-inferential-statistics.php
- Nearest Neighbour Analysis - http://geographyfieldwork.com/nearest_neighbour_analysis.htm
- This is a test for retail agglomeration
- Remember that you can also test for functional grouping, not just agglomeration
- This is a test for retail agglomeration
- Spearman Rank test of association: https://statistics.laerd.com/statistical-guides/spearmans-rank-order-correlation-statistical-guide-2.php and http://geographyfieldwork.com/SpearmansRank.htm
- You can also use Chi squared, T tests and others - stattrek.com has lots and lots of great advice http://stattrek.com/
Presentation of data
General presentation methods - http://www.geography-fieldwork.org/geographical_enquiry/stage4.htm
Do you need a bar graph or a histogram? http://stattrek.com/statistics/charts/histogram.aspx
|
Why I hate pie charts
Thankfully other people have already done this for me: http://www.businessinsider.com/pie-charts-are-the-worst-2013-6 and https://www.perceptualedge.com/articles/visual_business_intelligence/save_the_pies_for_dessert.pdf are fantastic at explaining why these methods shouldn't be used. That said, pie charts CAN be effective in SOME situations such as where there are only very few categories of data and you want to show their balance at different points, such as this map on the right. Even so, it can only provide the broad sweep of information and has major faults. |
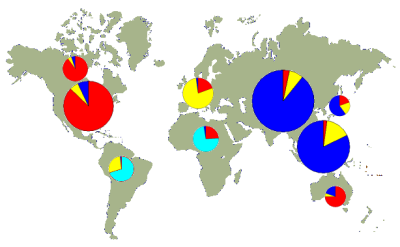
Source: http://www.neoformix.com/2007/InDefenseOfPieCharts.html (data is made up)
|
