the syllabus says: Examine the effects of structures and human activity on urban microclimates, including the urban heat island effect and air pollution.
| A useful file sourced elsewhere on the internet. |
Key terms
UHI - Urban Heat Island
UHII - Urban Head Island Intensity
Structures - Any artificial contstruction including buildings, scaffolding, landscaped vegetation, roads, paths and covered farmland (e.g. a greenhouse or plasticulture)
Human activities - any undertaking being done by humans
Microclimate - the average weather conditions of a small area
Urban heat island - the (usually) higher temperatures in a built up area. It is called an island because in map view, it appears as though the urban area is an 'island' of heat in a colder 'sea' of the rural area surrounding it.
And some harder ones:
Latent heat - 'locked up' energy, such as the energy in a glass of water preventing it from being frozen to ice
Insolation - solar energy received at the Earth's surface
Continental - the name given to a climate of an inland area. It is characterised by extremes e.g. hot summers and cold winters.
Maritime - the name given to a climate of a coastal area. It is characterised by mild conditions e.g. warm summers and mild winters
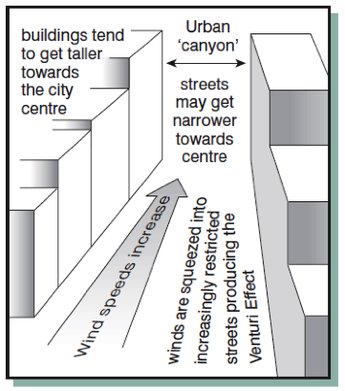
Canyons (in an urban context) - the gaps between tall buildings in dense urban areas. A good example is Queens Road Central in Hong Kong, or 7th Avenue around Times Square in New York. Canyons create shade and thus cooler temperatures, and can funnel winds increasing their speeds.
Albedo - the reflectivity of a surface. Dark surfaces have a lower albedo and absorb more heat.
UHI - Urban Heat Island
UHII - Urban Head Island Intensity
Structures - Any artificial contstruction including buildings, scaffolding, landscaped vegetation, roads, paths and covered farmland (e.g. a greenhouse or plasticulture)
Human activities - any undertaking being done by humans
Microclimate - the average weather conditions of a small area
Urban heat island - the (usually) higher temperatures in a built up area. It is called an island because in map view, it appears as though the urban area is an 'island' of heat in a colder 'sea' of the rural area surrounding it.
And some harder ones:
Latent heat - 'locked up' energy, such as the energy in a glass of water preventing it from being frozen to ice
Insolation - solar energy received at the Earth's surface
Continental - the name given to a climate of an inland area. It is characterised by extremes e.g. hot summers and cold winters.
Maritime - the name given to a climate of a coastal area. It is characterised by mild conditions e.g. warm summers and mild winters
Canyons (in an urban context) - the gaps between tall buildings in dense urban areas. A good example is Queens Road Central in Hong Kong, or 7th Avenue around Times Square in New York. Canyons create shade and thus cooler temperatures, and can funnel winds increasing their speeds.
Albedo - the reflectivity of a surface. Dark surfaces have a lower albedo and absorb more heat.
Microclimates and urban heat islands
A microclimate is the climate of any small area. An urban heat island is one type of microclimate. Other types include:
An urban heat island is created when an urban area becomes warmer than the surrounding area. The reasons for this are outlined below. As the graph below shows, the temperature to the centre of the urban area is higher than the surrounding area.
A microclimate is the climate of any small area. An urban heat island is one type of microclimate. Other types include:
- Snow-capped mountains – cold high up (angle of slope, less land immediately around them) and snow capped also reflect solar energy
- Trees give shelter reducing wind speed, and create shade making temperatures at ground level cooler.
- Lakes (and any large body of water) make summers cooler, and warmer in winter due to water heating up and cooling slowly.
- Seasonal vegetation changes during the year effect rural microclimates (trees losing leaves etc.)
- Farming rotations (ploughing changes the albedo, for example)
An urban heat island is created when an urban area becomes warmer than the surrounding area. The reasons for this are outlined below. As the graph below shows, the temperature to the centre of the urban area is higher than the surrounding area.
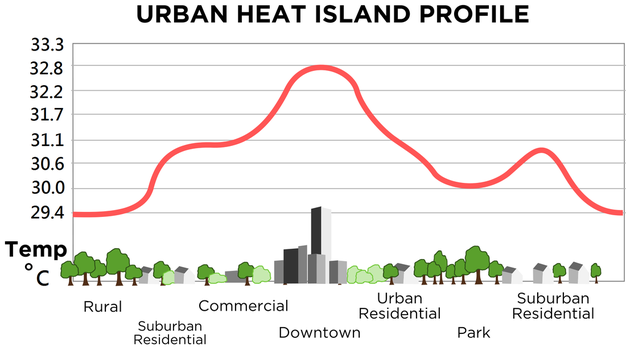
The result of this is an island effect. The map below shows a theoretical view of a city. The black lines ringing the centre are examples of isolines - lines on a map linking equal points. The effect is similar to that of an island in the sea.
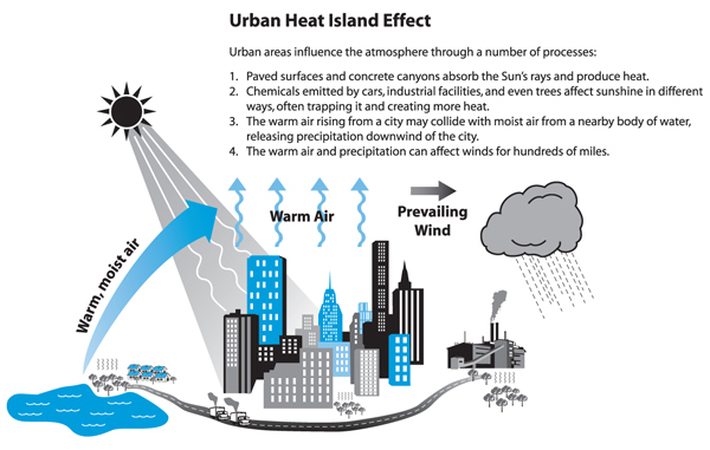
The urban heat island is created due to the impact of the built environment compared to the natural, rural environment.
Causes of urban heat islands
An excellent resource on all things UHI related is: http://www.urbanheatislands.com/.
An excellent resource on all things UHI related is: http://www.urbanheatislands.com/.
- Albedo - the darker surfaces reflect less energy, so the surfaces warm up
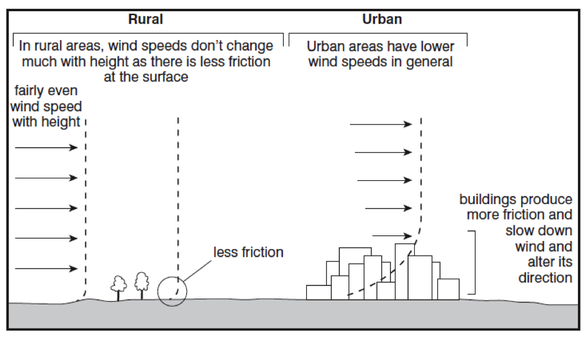
- High buildings - wind reduction
- Buildings in general - change in drag and shear
- Lack of vegetation - leads to increase in evaporative and evapotranspiration so potentially leading to more atmospheric moisture in the urban area
- General human activities: "Anthropogenic heat" - the extra heat generated by heating (or cooling) buildings, engines, etc.
Factors affecting urban heat islands
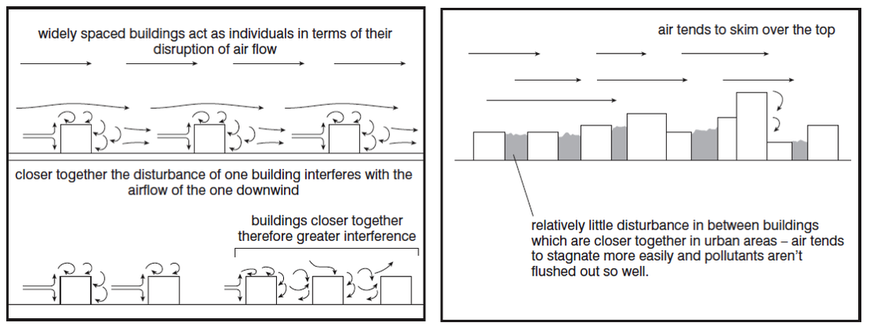
The diagrams below show some of the factors that affect microclimates in urban areas. They include:
- size of urban area
- building density
- canyonisation
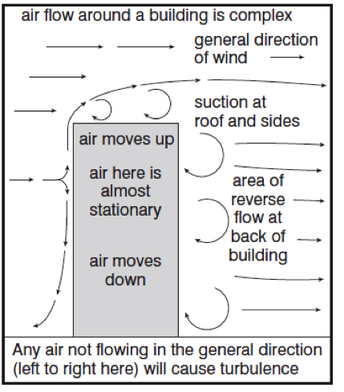
- building form
- albedo (more detail below)
The diagrams below show some of the factors that affect microclimates in urban areas. They include:
- size of urban area
- building density
- canyonisation
- building form
- albedo (more detail below)
|
|
Albedo
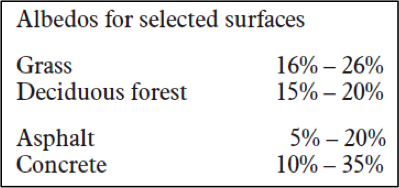
Another factor is the albedo of an area. Most urban areas are covered with relatively dark surfaces e.g. grey roads and pathways from tarmac and dark roof tiles. As the table below shows, albedo can vary widely between surfaces. (The table shows the amount of energy reflected directly back into the atmosphere.) The result is that urban areas will frequently absorb more energy which leads it to release that energy gradually, causing a warming effect in the local atmosphere.
Another factor is the albedo of an area. Most urban areas are covered with relatively dark surfaces e.g. grey roads and pathways from tarmac and dark roof tiles. As the table below shows, albedo can vary widely between surfaces. (The table shows the amount of energy reflected directly back into the atmosphere.) The result is that urban areas will frequently absorb more energy which leads it to release that energy gradually, causing a warming effect in the local atmosphere.
The overall impact of these features can be seen in the following videos from NASA and the Weather Channel (US).
Case study: Paris, 2003
In summer 2003, an anticyclone (area of high pressure which brings low wind speed and clear skies) over Europe caused a heatwave which wa blamed for the deaths of over 30,000 people. Most of these were in cities* including Paris where 4867 deaths were caused. The city of Paris sits in a lowland area surrounded by hills which reduced the free movement of air.
Daytime temperatures exceeded 38˚C. The highest number of deaths was among elderly women who lived alone. Part of the contributing factors was that this was the high summer in Paris and many families were on holiday and left elderly relatives behind. Bodies were left in the mortuary into September without being claimed - 57 remained on 3rd September.
The response was to create a heatwave plan for future events. The Plan Canicule aimed to better co-ordinate the various agencies involved in dealing with problems including transport, health care, humanitarian organisations, local government and national government. The plan was tested - and succeeded - in 2006 when a similar heatwave claimed only 46 lives.
*TOK link - most people in Europe live in cities, so this is to be expected. The question is whether there was a proportional increase in deaths from people in urban areas compared to rural areas.
The following article is taken from USA Today. It describes the huge impacts of the heat.
Posted 9/25/2003 10:56 AM Updated 9/25/2003 9:23 PM
France heat wave death toll set at 14,802
PARIS (AP) — The death toll in France from August's blistering heat wave has reached nearly 15,000, according to a government-commissioned report released Thursday, surpassing a prior tally by more than 3,000.
Scientists at INSERM, the National Institute of Health and Medical Research, deduced the toll by determining that France had experienced 14,802 more deaths than expected for the month of August.
The toll exceeds the prior government count of 11,435, a figure that was based only on deaths in the first two weeks of the month.
The new estimate includes deaths from the second half of August, after the record-breaking temperatures of the first half of the month had abated.
The bulk of the victims — many of them elderly — died during the height of the heat wave, which brought suffocating temperatures of up to 104 degrees in a country where air conditioning is rare. Others apparently were greatly weakened during the peak temperatures but did not die until days later.
The new estimate comes a day after the French Parliament released a harshly worded report blaming the deaths on a complex health system, widespread failure among agencies and health services to coordinate efforts, and chronically insufficient care for the elderly.
Two INSERM researchers who delivered the report were to continue their analysis of deaths to determine what the actual cause was for the spike in mortality, the Health Ministry said.
The researchers, Denis Hemon and Eric Jougla, were also to recommend ways of improving France's warnings system to better manage such heat-related crises in the future.
The heat wave swept across much of Europe, but the death toll was far higher in France than in any other country.
Health Minister Jean-Francois Mattei has ordered a separate special study this month to look into a possible link with vacation schedules after doctors strongly denied allegations their absence put the elderly in danger. The heat wave hit during the August vacation period, when doctors, hospital staff and many others take leave. The results of that study are expected in November.
The role of vacations is a touchy subject. The National General Practitioners Union says that only about 20% of general practitioners were away during the heat wave.
Other European countries hit by the heat have been slower than France to come out with death tolls, but it's clear they also suffered thousands of deaths.
Environmental experts warn that because of climate change, such heat waves are expected to increase in number in coming years, meaning Europe — a continent that historically has enjoyed a temperate climate — will have to make adjustments.
The urban rain effect: how humans make rain
A more recently understood phenomenon is the 'urban rain effect' whereby cities create rainfall. An extremely useful resource can be found here. Rain is created when water vapour condenses around tiny particles called hygoscopic nuclei. These can be made of any tiny particle in the atmosphere, including pollen, and pollutants. They are effectively seeds around which raindrops can form, which then collide and become heavy enough to fall as rain. The result: the weather can be wetter at weekends because of the increased pollution in the air from weekday commuter vehicles. Further details can be found here.
The video below shows how humans can increase the rainfall in an area. It is likely that humans do this naturally by polluting the atmosphere anyway!
