The syllabus says |
| ||
Evaluate life expectancy, infant mortality rate (IMR) and child mortality, HALE (health-adjusted life expectancy), calorie intake, access to safe water and access to health services as indicators of health.
Evaluating health measurements
Life expectancy
Life expectancy is simply the number of additional years a person is expected to live if current trends continue. This is usually expressed as life expectancy at birth - i.e. how long a baby born this year can expect to live if current trends continue. There are also age-specific life expectancies. These can be more accurate because they take account of the existing health problems that the age group might have had, such as malnutrition in childhood, or exposure to disease in their past.
Life expectancy at birth
Positives:
Age-specific life expectancy
Positives:
Negatives:
Life expectancy is simply the number of additional years a person is expected to live if current trends continue. This is usually expressed as life expectancy at birth - i.e. how long a baby born this year can expect to live if current trends continue. There are also age-specific life expectancies. These can be more accurate because they take account of the existing health problems that the age group might have had, such as malnutrition in childhood, or exposure to disease in their past.
Life expectancy at birth
Positives:
- Simple to understand
- Indicates healthcare significantly, because age of death largely depends on whether health problems are treated and prevented. Death is the ultimate in poor health!
- Ignores years which are spent in poor health
- Gives the mean, so doesn't reflect internal country disparity
- Tells you only about future lives (babies born this year) not the actual length of life someone in middle age might expect to live
Age-specific life expectancy
Positives:
- Includes historical health data that actually affects the current population and will affect how long they live
- Reflects the current, not future, population and their current status, not the future trends (because future trends becoming increasingly hard to predict for further into the future)
Negatives:
- Increases as the age group gets older because the unhealthy members of the cohort die
- Can be affected by migration
Infant mortality rate
IMR is the infant mortality rate, which is the number of deaths of children less than one year of age per 1000 live births. This is different to child mortality, which is identical except it relates to children aged less than five years. Both indicate health of a population because they relate to the treatment and prevention of disease. Note that death in childbirth does not count towards this statistic.
Positives:
Negatives:
IMR is the infant mortality rate, which is the number of deaths of children less than one year of age per 1000 live births. This is different to child mortality, which is identical except it relates to children aged less than five years. Both indicate health of a population because they relate to the treatment and prevention of disease. Note that death in childbirth does not count towards this statistic.
Positives:
- Indicates a key area of focus for health workers and researchers
- Can suggest reasons why the health of the population as a whole is poor
- Child and infant health has a close link to later life conditions
- Children are more susceptible to conditions that affect the general population e.g. water borne diseases
Negatives:
- Disproportionately affected by pre-natal, neo-natal and post-natal care
- Doesn't take into account the number of children who died in birth, but many post-birth deaths are directly related to similar causes e.g. maternal malnutrition
Health-Adjusted Life Expectancy
HALE is a World Health Organization measure that first appeared as DALE (Disability Adjusted Life Expectancy) in the World Health Report 2000 and was renamed in 20002 to HALE to better reflect other states of ill-health rather than just disability. It states the length of life that a person can expect to live in full health. Disabilities and health problems are provided with a weighting to assess how severe they are.
Positives:
- It is less crude than life expectancy
- Helpful for assessing the actual level to which a population is healthy, not just the level to which they live
- Can indicate if aid is getting through
- Severe lack of data on the health problems
- Complex
- Hides a huge variety within the data
Calorie Intake
Calorie intake describes the number of calories needed per person per day. A base level is usually considered 1200 before a person begins to starve.
Positives:
Calorie intake describes the number of calories needed per person per day. A base level is usually considered 1200 before a person begins to starve.
Positives:
- Easily comparable
- Has a major impact on health
- Especially useful for comparing low income countries which experience food shortage
- Doesn't allow for the variation needed due to location, personal size etc. ("calorie requirement")
- Doesn't take into account the balance of the diet
- Usually focuses on a minimum calorie intake, rather than a maximum - so obesity doesn't register as a major health concern
- Ignores major disparities within populations due to food prices (poorest people might have very little food, but live within a few metres of those who have too much)
Access to safe water
Again, access to safe water is a major influence on health. Without safe water, diseases are much more common. It also affects the immune system.
Positives:
Again, access to safe water is a major influence on health. Without safe water, diseases are much more common. It also affects the immune system.
Positives:
- Has a major impact on the health of a population
- Doesn't take into account the education levels of people, so even with safe water they might not practice hygienic sanitary practices
- Changing rapidly, especially in Asia, as a major focus of the Millenium Development Goals
- Highly variable within a population, as 'safe water' can mean different things (e.g. safe water source, versus safe water use)
- Universal in HICs so doesn't indicate much for more wealthy countries
- For poorer countries, the proportion of those with their own private supply might be more important than the proportion who can access group supplies, as distance to carry water isn't taken into account but might influence the amount used
Access to health services
Health services are discussed on the Variations in Health page. However, it's important to recognise how these can be measured.
Number of doctors per 100,000 - useful because the more trained professionals, the higher the general health of the population is likely to be. However, this doesn't discuss the skill level of the doctors, nor whether they have the funding to pursue the best treatment.
Expenditure per person - good in that it can indicate how important health is, but prices for healthcare vary wildly around the world. This also doesn't account for the actual cost of care as opposed to administration (which is usually much lower for private systems than public ones).
DALY
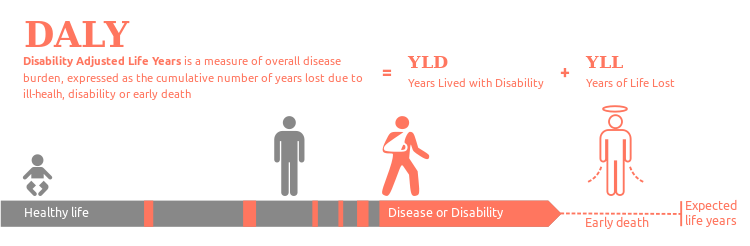
Source: https://en.wikipedia.org/wiki/Disability-adjusted_life_year
The Disability Adjusted Life Year is a measure of overall disease burden expressed as the number of years lost due to ill-health disability or early death. In other words, it tells you how many years a person can expect to lose from their total life expectancy. This is slightly different from the DALE or Disability Adjusted Life Expectancy which tells you how long a person can expect to live in full health and since 2002 has been known as the Health Adjusted Life Expectancy.
The DALY is reported through the World Health Organization's Global Burden of Disease study.
Positives (for both):
The DALY is reported through the World Health Organization's Global Burden of Disease study.
Positives (for both):
- Information is about health, rather than simple life expectancy
- Includes mental health, which is a significant factor in overall well-being
- It has been perceived by some as a utilitarian measurement, i.e. about how useful a person is to society, rather than valuing individuals as human beings
- It's a highly complex concept, with the weightings for different conditions being quite subjective
- It's not easy to understand. The difference between DALY and DALE is one such point of confusion as they are used interchangeably by non-experts.
The difference between DALY and HALE
It would be easy to think that HALE is simply regular life expectancy minus DALY. But this isn't quite accurate. DALY only accounts for the number of years lost, regardless of the overall life expectancy of a country. The difference is therefore:
A country that has a very high life expectancy might have many elderly people living with disability for many years. It would have a bad DALY score because people live many years in ill health. But they might still have a good HALE because those ill-health years are a small proportion of a very long life.
- DALY is a comparable value telling you how many years of health are lost on average within a country.
- HALE is a comparable value telling you how long people can expect to live in full health.
A country that has a very high life expectancy might have many elderly people living with disability for many years. It would have a bad DALY score because people live many years in ill health. But they might still have a good HALE because those ill-health years are a small proportion of a very long life.
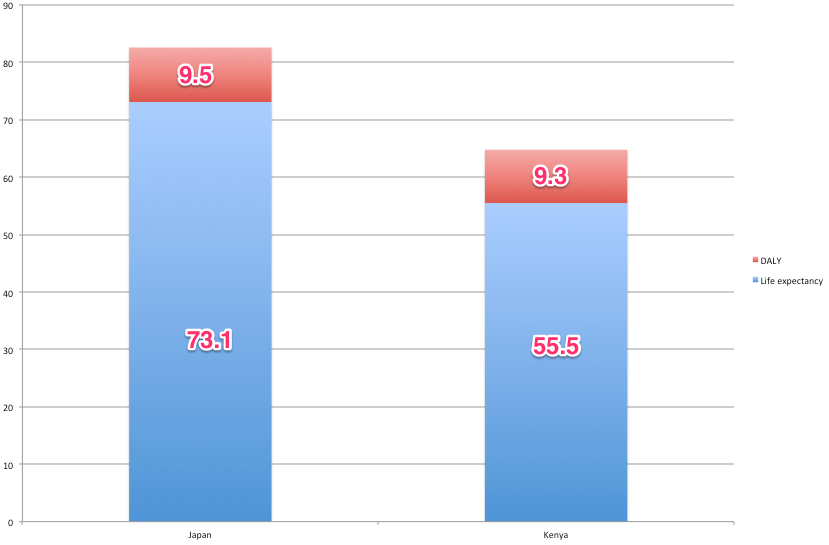
An example
Japan and Kenya exemplify how DALY and HALE can give different ideas. The graph below shows that Japan has a worse DALY than Kenya, at 9.5 years compared to 9.3 years. On the surface, it would appear that Kenya is losing fewer years to disability, so Kenya has the more healthy population.
However, Japan's HALE is significantly better than Kenya's at 73.1 years compared to 55.5 years. It's likely that Japan's population lives so long that they have more years of life in which to experience disability and disease.
So, the Japanese have a higher DALY than Kenya, but it is a much smaller proportion of their lifespan. They have such a long total life expectancy that they have more time in which to experience illhealth that is measured in DALY. The Japanese are therefore the healthier population of the two.
This shows how it's possible for a country to have an apparently 'bad' DALY while actually having a very healthy population.
Sources:
Japan http://www.healthdata.org/sites/default/files/files/country_profiles/GBD/ihme_gbd_country_report_japan.pdf
Kenya http://www.healthdata.org/sites/default/files/files/country_profiles/GBD/ihme_gbd_country_report_kenya.pdf
Japan http://www.healthdata.org/sites/default/files/files/country_profiles/GBD/ihme_gbd_country_report_japan.pdf
Kenya http://www.healthdata.org/sites/default/files/files/country_profiles/GBD/ihme_gbd_country_report_kenya.pdf
