The syllabus saysMeasuring disasters
|
Don't have Word? Download the file, then upload to Google Drive and 'Open in Google Docs'.
Note: this section also requires the case study of two disasters which can be found on separate pages.
| ||
quantifying the spatial extent and intensity of disasters
When quantifying the spatial extent and intensity of disasters, there are many different factors that can be used:
- number of deaths
- number of people affected
- impact on individual livelihoods
- speed and success of disaster response
- physical loss to housing and infrastructure
- loss of economic production
- extent to which state agencies were involved
- secondary effects e.g. disease from contaminated water
- the area in which people are directly affected by the hazard event
- the area from which assistance is drawn
Note: The information above is largely (but not entirely) sourced from the John Hopkins CRDR ICRC Public Health Guide Book.
This page looks at the issue of quantifying the changing impact and intensity of disasters over time through the use of number of dead and affected people. It starts with temporal changes, then looks at spatial variations. For details about how hazard events themselves are quantified (i.e. the physical event rather than the human impact), look at the 'Spatial Extent of Hazard Event' and 'Magnitude' sections of the Characteristics of Hazards page.
intensity and impacts of disasters: temporal changes
The EM-DAT International Disasters Database provides information for disaster relief agencies and government planners about the number, type and impacts of disasters worldwide.
The graph below shows the number of reported disasters, and the number of deaths and people affected, from 1900 to 2011. Note that 'reported disasters' may be increasing due to better communications more recently.
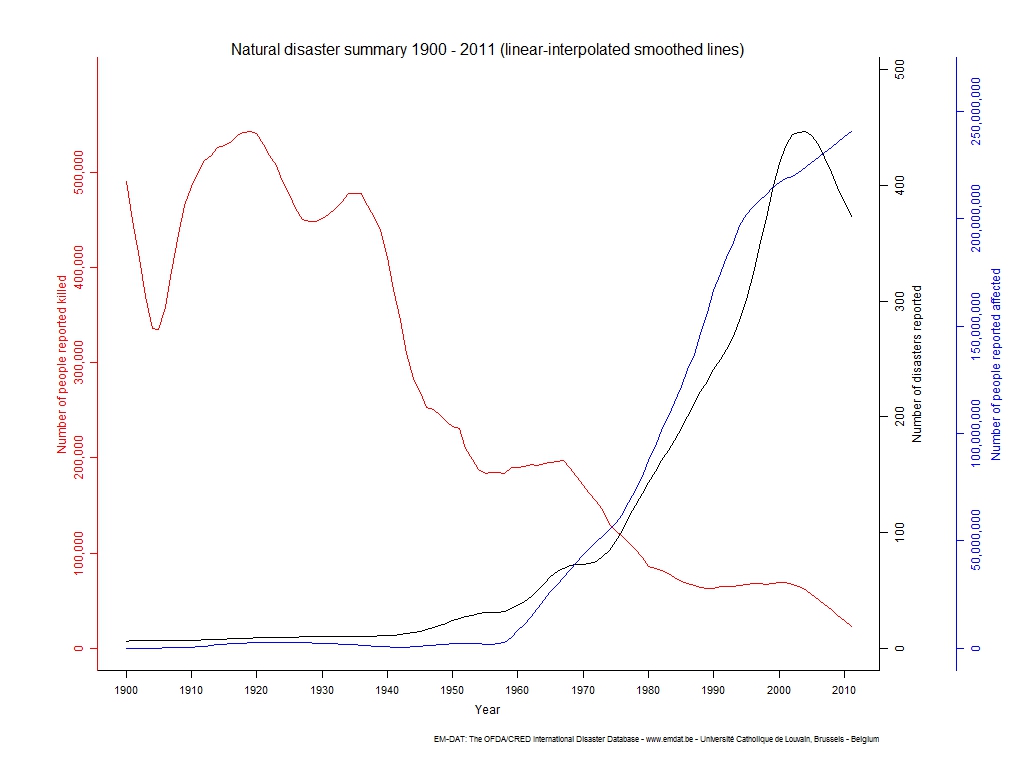
Source for graph above: http://www.emdat.be/natural-disasters-trends
INTENSITY AND IMPACTS OF DISASTERS: spatial variation
The map below left shows the number of disasters per country since 1975. Compare this to the map below right, which is the number of disasters per country per 100,000 people. Take note of the different time periods - though the pattern can still be assessed.
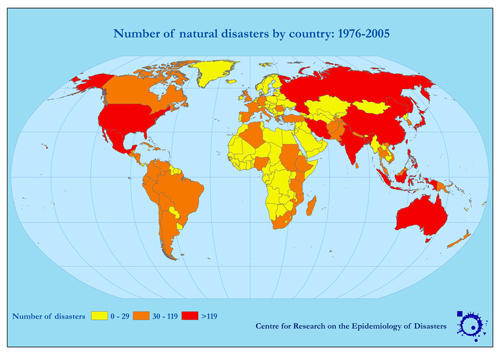
Source: http://www.emdat.be/sites/default/files/Maps/World/map1.jpg
|
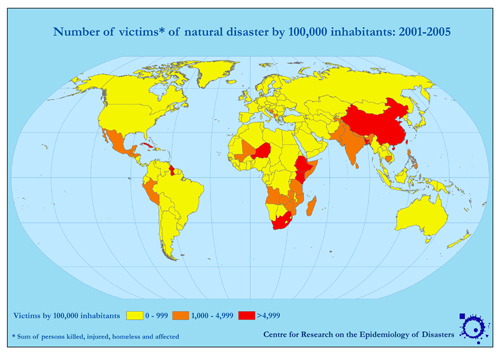
Source: http://www.emdat.be/sites/default/files/Maps/World/map1.jpg
|
The graph below shows the damage in US dollars caused by natural disasters.
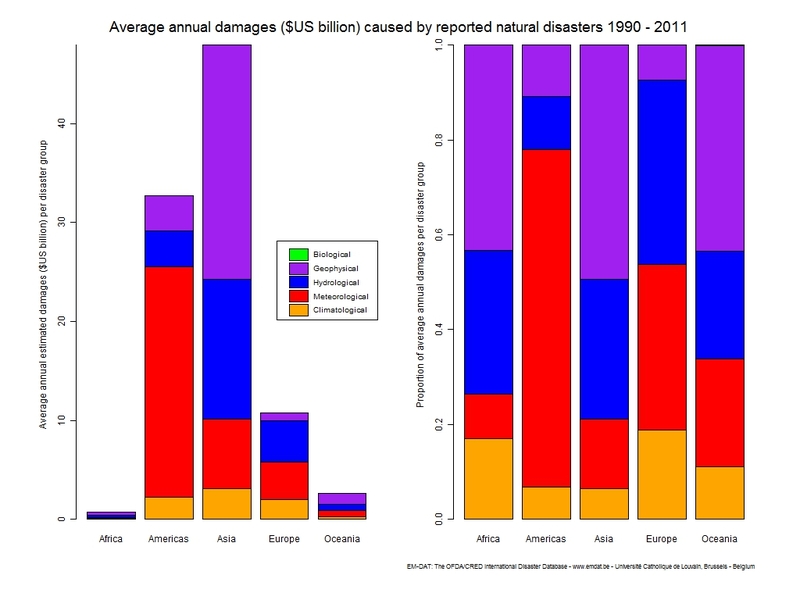
Source: http://www.emdat.be/sites/default/files/Trends/natural/world_1900_2011/damdisYA2_view.jpg
|
The map below shows the countries most affected by drought.
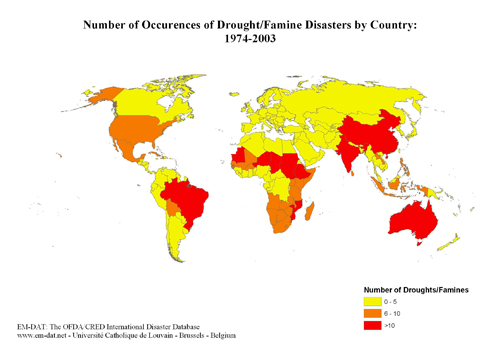
Source: http://www.emdat.be/sites/default/files/Maps/Disaster/map2.jpg
|
The map below shows the countries most affected by earthquakes.
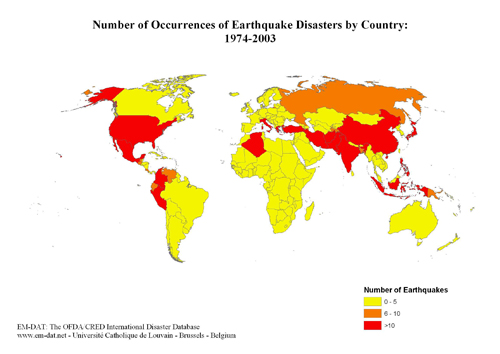
Source: http://www.emdat.be/sites/default/files/Maps/Disaster/map2.jpg
|
